# Web Dashboard: Operate bunqueue from Your Browser
Open-source web console for bunqueue: live health, jobs, DLQ, cron, workers, workflows, server control and a read-only SQLite inspector.
Canonical: https://bunqueue.dev/guide/dashboard/
---
import { Aside } from '@astrojs/starlight/components';
import DashboardArchitecture from '../../../components/DashboardArchitecture.astro';
import VideoPlayer from '../../../components/VideoPlayer.astro';
operations · dashboard
Operate your queue, not just watch it.
bunqueue dashboard is a free, MIT-licensed operator console for a bunqueue server. It covers live health, jobs, dead letters, cron, workers, workflows and the server process itself, and it disables any action the server cannot perform safely.
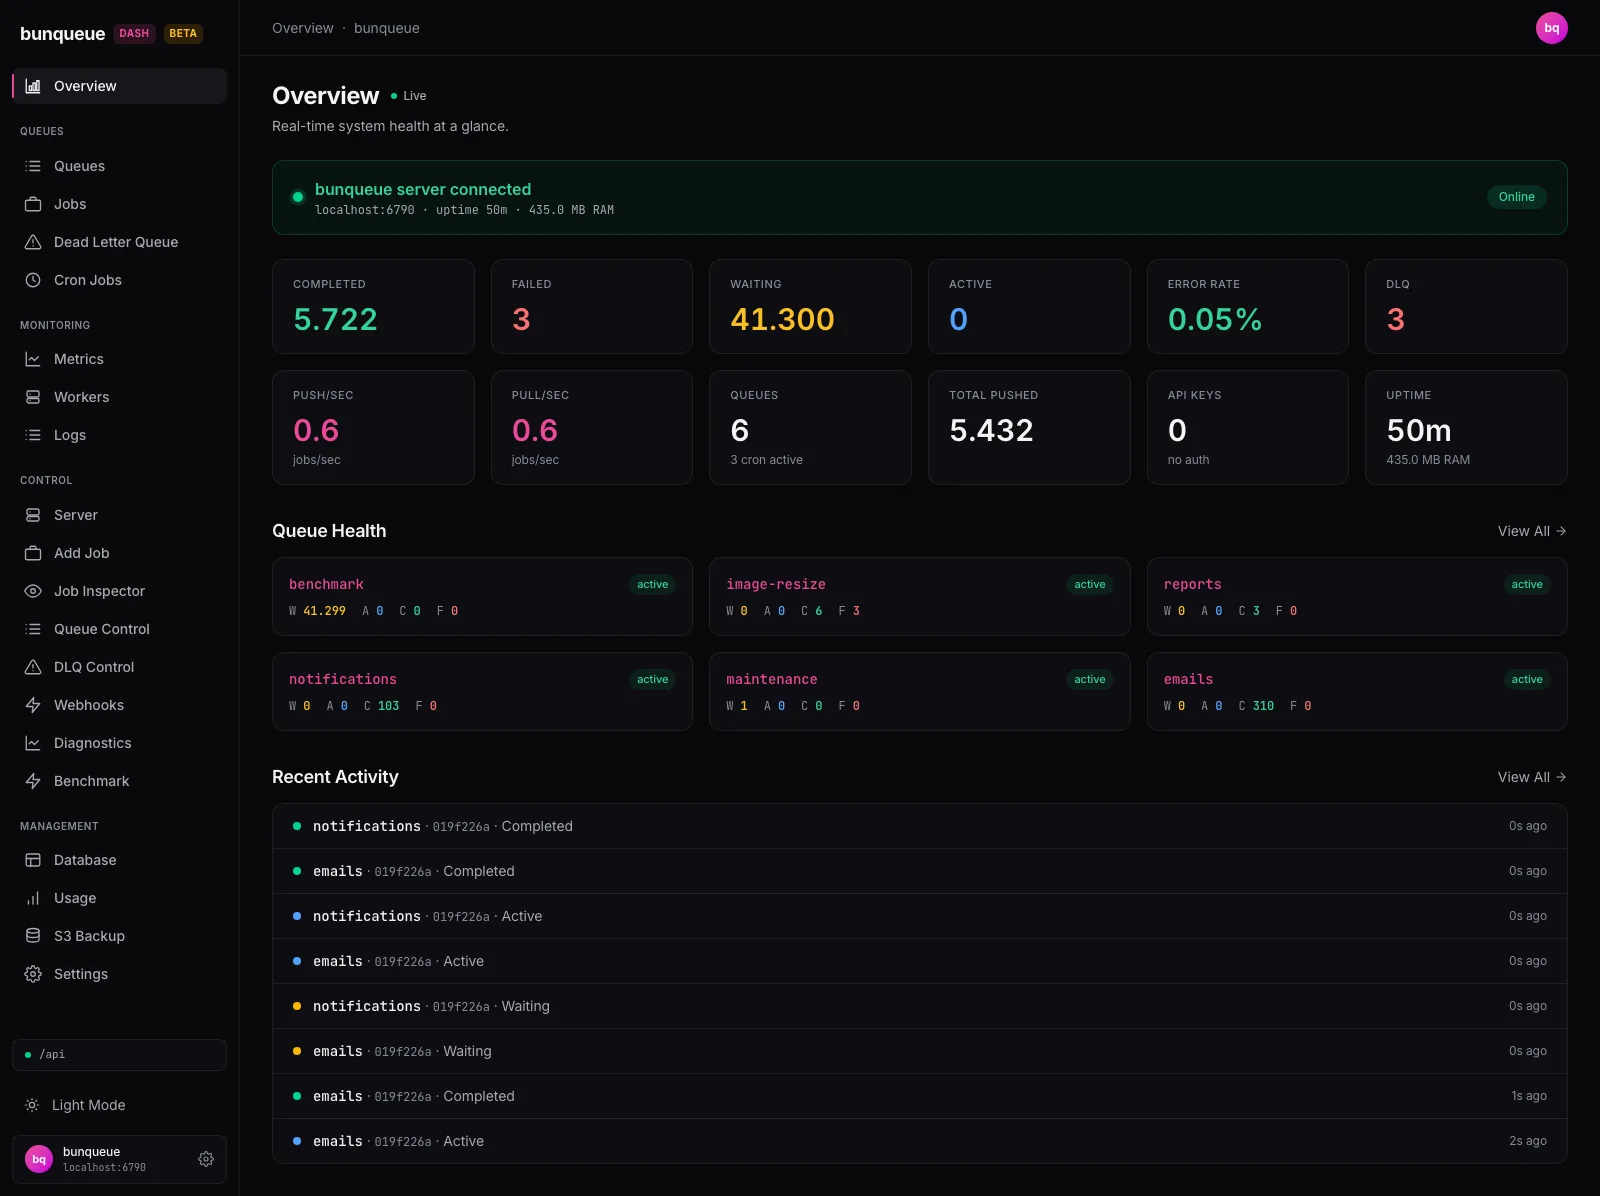
Video Full tour, 7:46: queues, jobs, flows, workflows and server control on a live server. Watch on YouTube ↗The Overview page: connection status, headline counters, per-queue health and the live activity feed. Captured against a seeded server.
## Quick start
The npm package requires exactly [Bun](https://bun.sh) 1.4.2 and refuses to start on other versions. On any other Bun version, or without Bun, use a [standalone binary](#deployment-options). One command serves the prebuilt dashboard and its control agent:
```bash
bunx bunqueue-dashboard
```
Open `http://127.0.0.1:8080`. The process:
- serves the dashboard on `127.0.0.1:8080`,
- proxies `/api/*` to your server's HTTP API at `BUNQUEUE_URL` (default `http://localhost:6790`),
- runs the control agent on `127.0.0.1:6800`.
No server yet? Start one from **Control ▸ Server**, or run `bunx bunqueue start` in another terminal (see [Running the Server](/guide/server/)). To connect to a server that runs elsewhere, set its HTTP address and turn off local process control:
```bash
BUNQUEUE_URL=http://queue.internal:6790 BUNQUEUE_MANAGED=0 bunx bunqueue-dashboard
```
With `BUNQUEUE_MANAGED=0` the dashboard reports health from `BUNQUEUE_URL` and never spawns, stops, restarts or reconfigures a process. Use it for any server that systemd, Docker or Kubernetes supervises. Pages that use the HTTP API work against a remote server. Operations that run through the control agent (Queue SDK controls, Job Flows, the Workflow Engine, the Database inspector and S3 backups) need a server on the same host that matches the agent's server configuration (HTTP port and data path).
To keep the command installed instead of fetching it each time:
```bash
bun add -g bunqueue-dashboard
bunqueue-dashboard
```
Want to look first? The [live demo](https://egeominotti.github.io/bunqueue-dashboard/) runs in your browser with sample data and needs no server.
## What you can do
| Area | Pages | Capabilities |
| --- | --- | --- |
| Overview | Overview, Fleet | Server health, throughput, per-queue status and recent activity. Fleet probes several brokers at once and groups those that share a PostgreSQL target. |
| Jobs | Queues, Jobs, Job Inspector, Add Job, Bulk Add | Server-paginated browsing by state; payload, result and timeline for any job; single, JSON and NDJSON enqueue; promote, re-prioritize and delay. |
| Failures | Dead Letter Queue, DLQ Control | Failure reasons, attempt history and CSV export across queues. |
| Scheduling | Cron Jobs | List schedules, create cron or interval schedules, and delete them. |
| Queue policy | Queue Control | Pause and resume, rate limits, concurrency, stall detection, deduplication and queue metrics. |
| Workflows | Workflow Engine, Job Flows | Start, signal, inspect, compensate and archive [workflow](/guide/workflow/) executions; explore [flow](/guide/flow/) DAGs and create flows. |
| Observability | Metrics, Workers, Logs, Alerts, Diagnostics | Throughput, queue depth and latency percentiles, worker liveness, the live event stream, browser-local alert thresholds and connectivity checks. |
| Server | Server | Start, stop and restart the server process, edit its ports, data path and environment, and follow its logs. |
| Data | Database, S3 Backup | Read-only SQLite inspector with a query runner. Configure, list, create and restore [S3 snapshots](/guide/backup/) with guarded restore. |
| Integrations | Webhooks, MCP, Copilot | Register and toggle [webhooks](/guide/webhooks/), connect the [MCP server](/guide/mcp/), and use the experimental AI Copilot. |
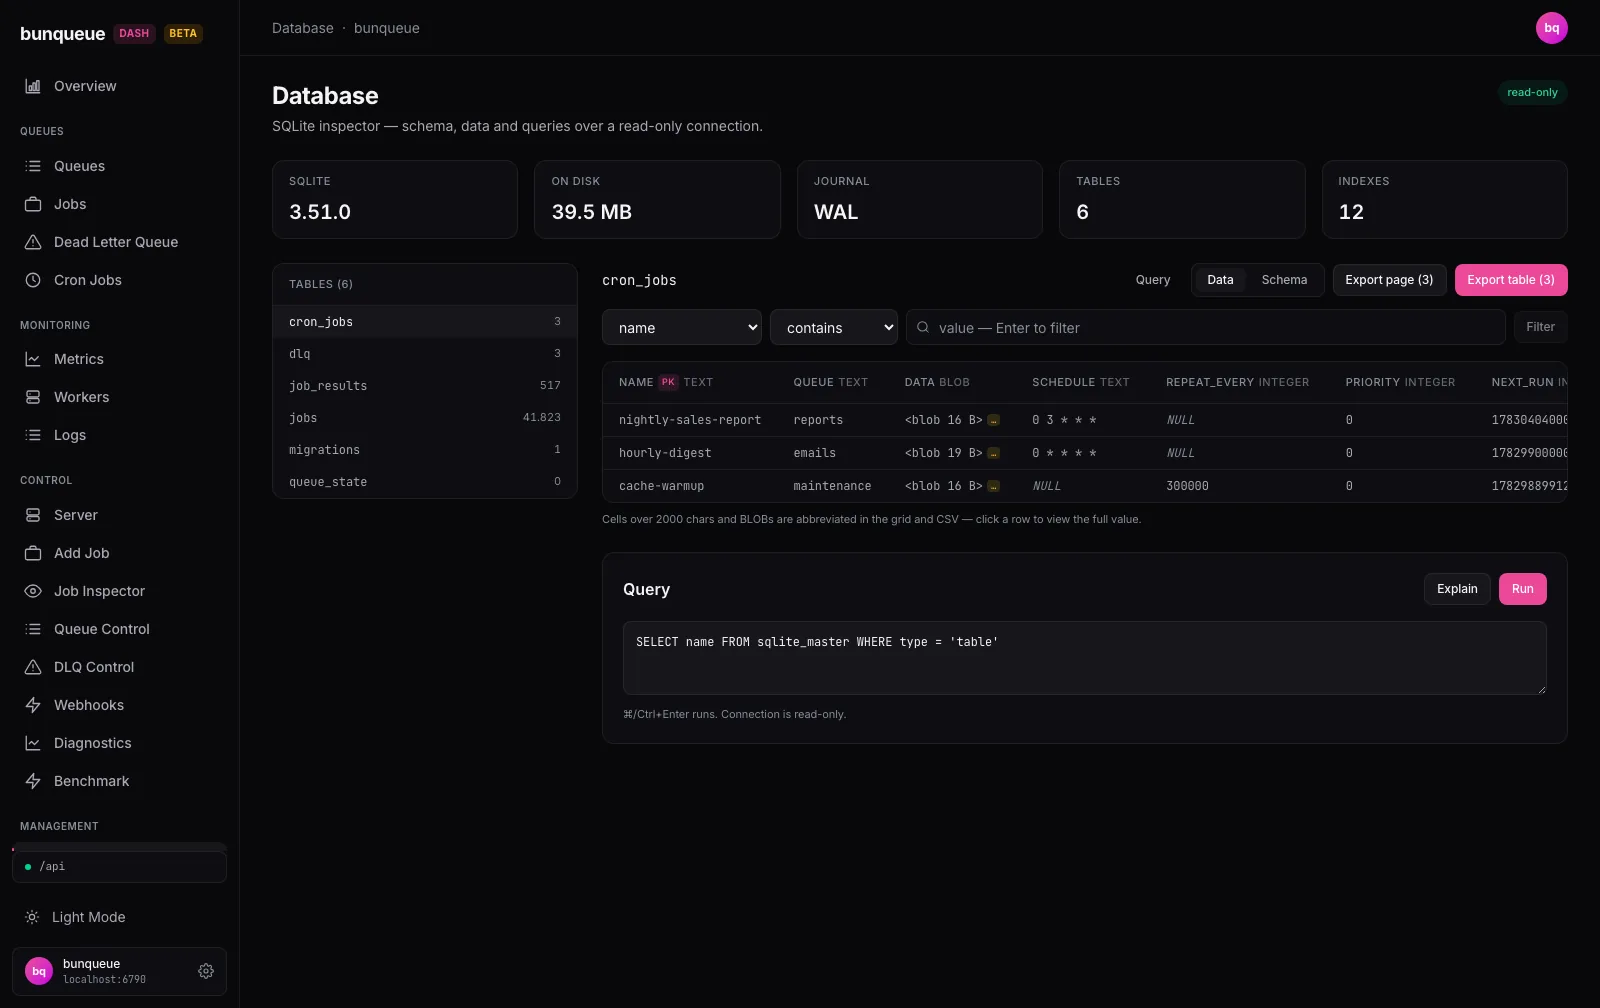
The Database page opens the SQLite file over a read-only connection.
## How it connects
- **Reads** use polling and a Server-Sent Events stream from the public HTTP API.
- **Writes** go through the same HTTP API. The dashboard checks each mutation's request and response shape against the live server.
- **Managed operations** run through the local control agent: process lifecycle, Queue SDK controls, FlowProducer, the Workflow Engine, SQLite inspection and backups. The agent uses the published bunqueue npm client and never patches bunqueue internals. Its SDK bridges support [native TLS](/guide/tls/) with a private CA.
- **Several brokers** take one named profile and one paired agent each. Settings holds up to 32 profiles, and the Fleet page probes them all without switching the active one.
## Actions that fail closed
The dashboard exposes an operation only when it can perform it safely through bunqueue's public HTTP API or client SDK. Some operations have no atomic precondition on a job's identity or dependencies. The dashboard disables those rather than risk acting on a different job.
| Operation | Behavior | Reason |
| --- | --- | --- |
| DLQ retry and removal | Unavailable | A job can be recreated under the same custom ID between the read and the write. |
| Requeue a completed job | Unavailable | A requeue does not rebuild the job's flow dependencies or ordering. |
| Cancel, Discard, Drain, Clean, Obliterate, DLQ purge | Unavailable | Each can delete a job that another queue still depends on. |
| DLQ `maxAge` and `maxEntries` | Read-only | Lowering either can delete entries immediately. Auto-retry can be turned off, not on. |
| Create a cron schedule | Confirmed upsert | The form refuses a name that already exists and checks again just before sending. The server call is an upsert, so two clients creating the same new name at once can overwrite each other; the confirmation asks you to accept that. |
| Copilot actions | Promote, Pause, Resume only | You confirm each proposal before it runs. |
When you have confirmed the target yourself, run those operations from the [CLI](/guide/cli/), the [Queue API](/guide/queue/control/) or the [DLQ API](/guide/dlq/operations/). The dashboard's [known issues](https://egeominotti.github.io/bunqueue-dashboard/docs/known-issues) page records every constraint with its source file.
## Deployment options
| Method | How | Includes the control agent |
| --- | --- | --- |
| npm, on demand | `bunx bunqueue-dashboard` | Yes |
| npm, installed | `bun add -g bunqueue-dashboard`, then `bunqueue-dashboard` under your process supervisor | Yes |
| Standalone binary | Download from [GitHub releases](https://github.com/egeominotti/bunqueue-dashboard/releases): Linux x64/arm64, macOS x64/arm64, Windows x64. No Bun needed on the host. | Yes |
| Container | `ghcr.io/egeominotti/bunqueue-dashboard`: `latest` and `vX.Y.Z` on releases, `edge` on `main`. Caddy serves the static UI. | No |
| Static host | `bun run build` in the dashboard repository, then serve `dist/` from any CDN | No |
The npm package and the binaries share one set of runtime variables, and both run the token boundary described below. The container image and static builds serve only the UI. The browser then calls bunqueue directly, so:
- set [`CORS_ALLOW_ORIGIN`](/guide/env-vars/) on the bunqueue server to the dashboard's origin,
- protect the server with [`AUTH_TOKENS`](/guide/server/) or authentication at your proxy,
- set the server URL in **Settings**, or at build time with `VITE_BUNQUEUE_URL`.
Kubernetes, PM2, Fly.io, Render, Cloud Run and other targets are covered in the dashboard's [deployment guide](https://egeominotti.github.io/bunqueue-dashboard/docs/deploy/).
## Configuration
The npm package and the standalone binaries read these variables:
| Variable | Default | Purpose |
| --- | --- | --- |
| `PORT` | `8080` | Dashboard HTTP port. |
| `BIND_ADDR` | `127.0.0.1` | Dashboard bind address. |
| `BUNQUEUE_URL` | `http://localhost:6790` | bunqueue HTTP API that `/api/*` is proxied to. |
| `BUNQUEUE_MANAGED` | `1` | `1` enables local start, stop and restart. `0` attaches to an externally supervised server. |
| `BASE_PATH` | `/` | Mount prefix behind a reverse proxy, for example `/internal/queue`. |
| `AGENT_PORT` | `6800` | Control agent port. |
| `AGENT_TOKEN` | none | Bearer token required on every bridged agent route for LAN or proxy access. |
| `BUNQUEUE_TOKEN` | none | Bearer token required on every `/api/*` route for LAN or proxy access. |
| `AGENT_ALLOWED_HOSTS` | loopback names | Extra Host names or IPs that the dashboard and agent accept. |
| `AGENT_ALLOWED_ORIGINS` | development defaults | Extra browser origins allowed to call the agent. |
| `TRUST_PROXY` | off | `1` trusts an `X-Forwarded-Host` that your proxy overwrites. |
`VITE_*` variables are build-time values for the static build and seed the first profile in Settings. Vite compiles them into the public bundle as plain text, so never put a token in one. Enter tokens in **Settings** or at the sign-in prompt; they are kept in memory only, so reloading the page clears them.
## Security model
The control agent can spawn and stop processes, so its defaults are restrictive:
- It binds to `127.0.0.1` only.
- CORS is limited to an allowlist and is never `*`.
- A request with a disallowed `Origin` gets `403` before it reaches the process manager, which blocks cross-site requests from another tab.
- A Host allowlist blocks DNS rebinding and rejects unknown names.
- Without `BUNQUEUE_TOKEN`, an `/api/*` request that the dashboard identifies as LAN or proxied gets `403` before anything reaches bunqueue. Requests that look local need no token unless `AGENT_ALLOWED_HOSTS` lists a non-loopback name or `TRUST_PROXY=1` is set; see steps 2 and 4.
- Responses deny framing, MIME sniffing and referrer leakage.
To give a team access over the network:
1. **Set both tokens.** Use one of the server's `AUTH_TOKENS` as `BUNQUEUE_TOKEN`, so the token the dashboard forwards is also valid upstream.
2. **Allowlist the names you serve.** Put each hostname or IP in `AGENT_ALLOWED_HOSTS`, or its full origin in `AGENT_ALLOWED_ORIGINS`.
3. **Put user authentication in front.** Host and Origin checks are not user authentication. Use your SSO or identity-aware proxy, and terminate TLS there.
4. **Keep proxied requests identifiable.** Once `AGENT_ALLOWED_HOSTS` lists a non-loopback name, the dashboard requires tokens on every `/api` and `/agent` request. Forward the original `Host` header (for nginx, `proxy_set_header Host $host;`) so requests match that name. If your proxy must rewrite `Host`, allowlist the rewritten name too, and set `TRUST_PROXY=1` only when the proxy overwrites `X-Forwarded-Host`.
```bash
# Runs behind an authenticating reverse proxy on the same host, which
# terminates TLS. Read both tokens from your secret manager.
AGENT_ALLOWED_HOSTS=queue-console.example.com \
AGENT_TOKEN="$DASHBOARD_AGENT_TOKEN" \
BUNQUEUE_TOKEN="$BUNQUEUE_AUTH_TOKEN" \
BUNQUEUE_URL=https://bunqueue.internal:6790 \
BUNQUEUE_MANAGED=0 \
bunx bunqueue-dashboard
```
The dashboard keeps its default `127.0.0.1` binding, so only the proxy can reach it, and browser traffic is encrypted up to the proxy. Two hops still carry tokens:
- **Dashboard to bunqueue.** The `/api` proxy forwards the server token to `BUNQUEUE_URL`, and the agent's health check sends it too. When the server runs on another host, enable [native TLS](/guide/tls/) and use an `https://` URL with a certificate the dashboard host trusts, or keep that hop on a trusted private network.
- **Proxy to dashboard.** Port `8080` serves plain HTTP. If the proxy runs on another host, set `BIND_ADDR=0.0.0.0`, restrict port `8080` to the proxy with a firewall or network policy, and keep that link on a trusted network.
Keep the agent's own port, `6800`, on loopback. Remote clients reach it only through the dashboard's authenticated `/agent` bridge.
## AI Copilot (experimental)
The Copilot answers questions about live queue state and can propose Promote, Pause and Resume, which you confirm. It stays off until you add a model. Choose Claude, ChatGPT, Gemini, GLM, OpenRouter or any OpenAI-compatible endpoint, including a local Ollama or LM Studio, and paste your own key. The key stays in memory for the session and is never written to disk.
Requests go from your browser straight to the provider you choose, together with the queue state the Copilot reads. Some providers, including OpenAI, block direct browser requests, and support for others depends on their browser (CORS) policy. Use an endpoint that accepts browser requests, such as your own proxy. Check your data-handling policy before you use it with personal or regulated job data. A local endpoint such as Ollama keeps that data on your network.
## Testing and compatibility
Each dashboard release pins the bunqueue client its control agent uses, and its CI runs disposable real servers of that version (bunqueue 2.9.4 for the current release). Check the dashboard's release notes before upgrading either side. Those runs cover SQLite schema upgrades, TLS, and three authenticated brokers sharing PostgreSQL. A Playwright suite drives every sidebar route on Chromium, Firefox and WebKit, including recovery of the live event stream across a server restart and automated WCAG A/AA checks. The [verification matrix](https://egeominotti.github.io/bunqueue-dashboard/docs/testing) lists each command and what it proves. The live demo uses sample data and is not test evidence.
## Resources
- [Live demo](https://egeominotti.github.io/bunqueue-dashboard/): every page with sample data
- [Dashboard documentation](https://egeominotti.github.io/bunqueue-dashboard/docs/): an illustrated user guide for each page, architecture and API mapping
- [Source on GitHub](https://github.com/egeominotti/bunqueue-dashboard): MIT license, issues and releases
- [npm package](https://www.npmjs.com/package/bunqueue-dashboard)
- In this site: [Monitoring](/guide/monitoring/), [Running the Server](/guide/server/), [Native TLS](/guide/tls/), [Environment Variables](/guide/env-vars/)